Ultimate guide to most handy and free SEO Tools 2018
Everyone loves free things. Especially when “free” really means free and indeed gives your website traffic, clients, money, rank, reputation, etc. Fortunately, there are many real free SEO tools in the SEO world. The downside is that some of these free tools are trash.
I want to give you (for free) a collection of free SEO tools. These are intuitive, elegant, practical, powerful and above of all – free.

1. Google Webmaster Tools
Among many SEO tools, Google Webmaster Tools is one of the most useful. It does not have all the advantages of commercial SEO suites. Furthermore is not a tool for SEO needs but comes from Google itself and provides a lot of detailed SEO information. All these are good reasons to use Google Webmaster Tools (if you do not already).
What is Google Webmaster Tools?
It’s not hard to guess that Google Webmaster Tools are a set of webmaster tools. However, what you do not know right away is that it’s a handy set of tools that you can use to communicate with Google and customise many aspects of how Google sees your site, such as external and internal links to your website. The crawling rate at which Google Bot indexes your site checks the keywords people enter on your site. The clickthrough rate for each keyword, the statistics on your site, and more.
If you use Google Webmaster Tools with Google Analytics, the results will be even better. You can access data from your Google Webmaster tools directly from Google Analytics. If you already use Google Analytics, you can easily integrate them into Google Webmaster Tools with a little extra effort.
How do I get started?
In order to use Google Webmaster Tools, you need to join it first. You can do it from here. After you join, you need to go through the verification process, so that Google knows you are the legit owner of the site you want to use Google Webmaster Tools on.
There are several ways to verify ownership. The first one is to download an HTML file and to upload it to the root directory of your site. Another one is to add an HTML tag into the head of your home page. If you are using the same Google account for Google Analytics, a third option to verify ownership is through Google Analytics. There are more ways to verify ownership but if you are interested in them, check the Google Webmaster Tools settings and you will see them.
Google Webmaster Tools to Use Daily
Once you have verified your ownership and have Google code in place on your site, you can now start enjoying the advantages of Google Webmaster Tools. When you log into your Google Webmaster Tools account, the first thing you see is the dashboard:
From here you can access all the major sections: Search Queries, Links to Your Site, Crawl Errors, Keywords, and Sitemaps. Clicking on any of these will open the respective section.
Search Queries
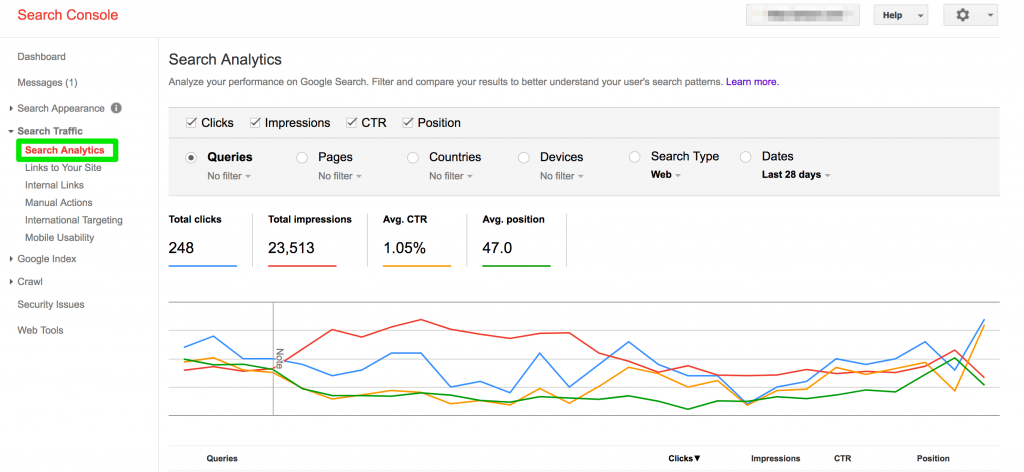
The Search Queries section shows the keywords that led users to your site.
This long list shows which keywords users searched for when they came to your site. It is best if this list matches the keywords you are optimizing for but very frequently this list contains good keywords you were unaware of. In this case, pick these good keywords and start optimizing for them, too.
In the Search Queries section, you can also see the number of impressions and the number of clicks. This gives you an idea about the CTR for the keyword. All equal, a higher CTR means the keyword is relevant, so you might want to invest some more efforts into this keyword. However, if you notice that as a result of your efforts, the CTR goes down, it is best if you don’t touch this keyword anymore.
Links
The second very useful section of Google Webmaster Tools is the Links to Your Site section.
Here you can see where your backlinks (internal and external) come from, as well as the pages they are linking to. As with other link checking tools, don’t expect to display every single link to your site, but nevertheless this list of backlinks is useful to check from time to time.
Crawl Errors
The Crawl Errors section shows the errors Google bot encountered on your site. The data you get is similar to what you get when you use the Spider Simulator and it shows inaccessible pages, missing pages, server errors, and all sorts of problems that prevented Google from correctly crawling your site. You also get some other crawl stats (such as the number of pages crawled a day) that are useful to know.
Keywords
Similarly to the Search Queries section that also deals with keywords (but it is the ones users type to get to your site), the Keywords section also shows keywords. However, the difference is that here you see what keywords (and their significance) Google has found on your site. The two lists (of keywords users type and the keywords Google finds on your site) could be very different, which means you are not optimizing for what users are searching for.
The Keywords section also allows to see the theme of your site, which post Panda has become even more important.
Sitemaps
The last section you can access from the Dashboard is the Sitemaps section. Here you see the sitemaps of your site Google has found and the number of URLs in them. If the sitemap found by Google is different from what you expected it to be, you can submit a new sitemap for Google to use.
Robots.txt and Other Advanced Stuff
The sections described so far are the basic Google Webmaster Tools sections. There is also a lot of advanced stuff in each of them but we won’t describe it into details. For instance, you can use your Google Webmaster Tools to submit a robots.txt file, or to set the preferred domain syntax (i.e. with or without www) to be displayed in search results. Google Webmaster Tools also allows to know if your site is infected with malware. If it is, you need to clean it first and then resubmit it for review.
Google Webmaster Tools is a really valuable instrument for SEO. It gives you at a glance data about all important SEO aspects of a site, such as keywords, links, crawl errors, etc. If you don’t use it already, take the time and get familiar with it ‐ it will help you get better rankings for sure.
2. Google Analytics

Google Analytics for SEO industry is like water for our world. We cannot live without it.
You may have already heard about Google Analytics. Google Analytics is the web analytics platform used by the majority ofsites. It has its eccentricity, but it’s the best readily available, all-round analytics tool available for understanding site traffic. And the best part is it’s free
If you have not installed Google Analytics, stop reading this post, urgently install Google Analytics, and bollock your web developer. I am not joking. Without the Google Analytics setup, developing an online business is like trying to fly a plane blindfolded. Without Google Analytics, it’s hard to determine what’s working and what’s not, to identify and solve problems before they cause major problems and make sense of your company’s overall direction. Google Analytics is suitable for monitoring the performance of a business and is suitable for approximately 95% of businesses.
To start using Google Analytics, go to the URL below and click Sign In. Create a Google Account if you do not have a Google Account yet and follow the simple steps to get started. You may need help from your web developer if you cannot change the code on your site.
Let me tell you something a little risky. In itself, most of the data is useless. You have read it correctly, for real awareness and ideas, we must be able to compare data and identify trends over time. There are two ways to analyze and understand data in Google Analytics in terms of time:
Compare two date ranges.
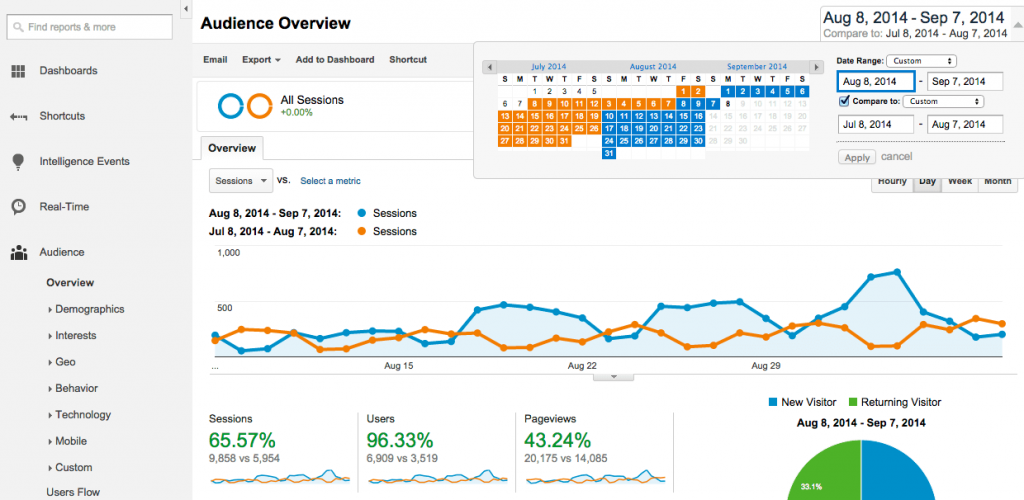
Click on the date field entry in Google Analytics. Enter two timeframes and you can compare them both. Comparisons of useful dates include comparing this week’s yield with last week’s performance, last month’s performance against the previous month and last month’s performance compared to the same month last year. You are also able to setup your own, custom dates ranges
2. View the charts for a long time.
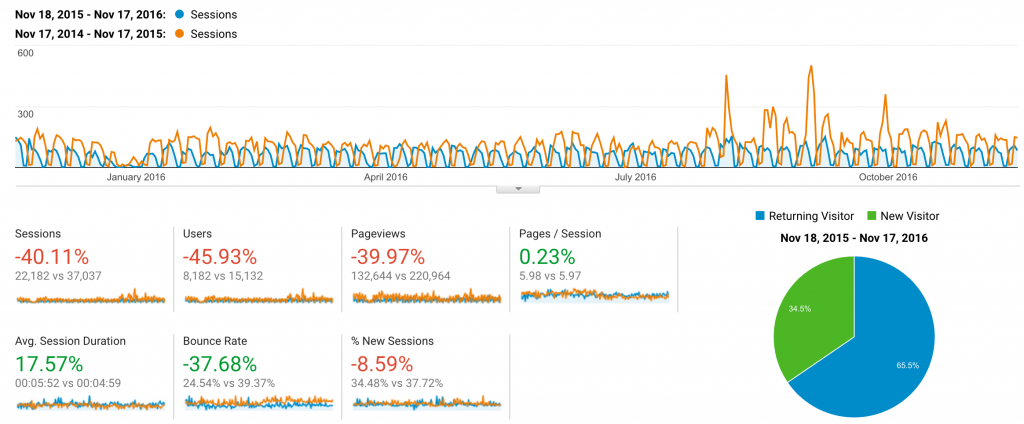
Just look at the charts in the longest possible time and look for the trends, without comparing the date ranges. This is not very effective in finding difficult to find information or in finding granular information, but this approach is useful for getting an overview of where your traffic is going.
Acquisation
Acquisition is a area of Google Analytics that any business owner or marketer should spend a lot of time on. The Google Analytics’s Acquisition section detects the origin of traffic to your site. Without careful monitoring of your traffic sources, it’s almost impossible to make informed judgments about the performance of your website or marketing.
Click on “Acquisition” in the left sidebar. In the “All traffic” section, you can view the actual traffic volumes that you have received from a particular source. The “Channels” section listed under “All Traffic” is of particular interest. It lists the main sources that send customers to your website. The “Channels” tab lets you deepen your understanding of the performance of specific sources that sends traffic to your site, such as: Social visitors, search engine visitors, e-mail visitors, and so on.
3. Moz Bar
Basics of MozBar
The Moz Tool Bar (or MozBar) toolbar is an easy way to display onpage SEO elements and to link data for each page on the web. It is available as a free download for Firefox and Chrome users. Although you need to pay a subscription as a pro user to see all the metrics. 30 days trial available from Moz is a good way to get familiar with MozBar or to analise and obtain needed data. The free version provides valuable SEO information as well as easy access to other free Moz tools.
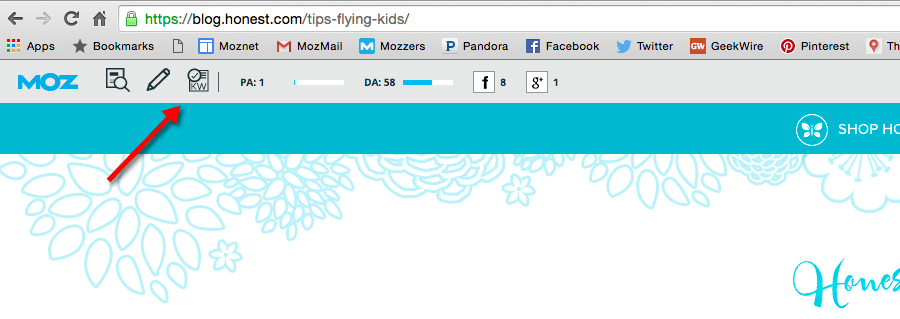
Understand Moz metrics
The MozBar automatically displays page authority (PA), domain authority (DA), and MozRank (mR) for each page you visit. This information is useful for your own websites, but also for market research on competitors and websites that you want to emulate. These statistics can also be displayed as a SERP overlay. You can view the statistics for each website on a search results page.
As a pro user you can also see MozTrust (mT), Domain MozRank (DmR), and Domain MozTrust (DmT). These metrics were developed by Moz to evaluate the authority of a website, much like the ranking of the Google Toolbar pages. These are references to authority based on criteria that Moz considers important.
In the MozBar you can visually highlight the different types of links on each page you visit: tracking and not tracking, internal and external, and also highlighting the keywords on the page. This is useful for your own website, as you can easily see if all the links on your page meet your expectations.
Other excerpts of information provided by MozBar for free are the IP address of a website, among the page elements and attributes, general information on the page, such as headers, meta words, keywords and description and the number of characters in each.
4. Google PageSpeed Insight
PageSpeed Insights is a free tool that allows webmasters to measure the performance of individual web pages on mobile and desktop devices. Although page speed is commonly confused with website speed, the former is actually more critical, since it deals with landing pages that may include sales and lead generating landing pages.
The PageSpeed Insights application retrieves each URL once on a desktop client and once on a mobile client to get a score of 100 points. Google recommends that you score 85 or higher.
Although the performance of a webpage is primarily determined by the user’s network connection, there are many things you can do to ensure that your site and pages are optimally configured for better performance
After analysing the performance of a web page, PageSpeed Insights provides suggestions in the form of coloured icons that inform you of page stats, optimisation suggestions, and things that work best.

How to Measure Performance with PageSpeed Insights
Using the PageSpeed Insights application could not be simpler. Just type your website address, click “Analyze” and full report will be ready to view within seconds.
At the top of the report, you will see a page stats, such as size of the page and how many resources and render-blocking round trips is needed to load the page and
In the next section, Google provide us with optimisation sugestions i.e. which areas of your website should be corrected to meet requirements suggested by the tool.
Here are some of the many ways to increase your page speed:
Enable compression
Use Gzip, a software application for file compression, to reduce the size of your CSS, HTML, and JavaScript files that are larger than 150 bytes.
Do not use gzip on image files. Instead, compress these in a program like Photoshop where you can retain control over the quality of the image. See “Optimize images” below.
Minify CSS, JavaScript, and HTML
By optimizing your code (including removing spaces, commas, and other unnecessary characters), you can dramatically increase your page speed. Also remove code comments, formatting, and unused code. Google recommends using CSSNano and UglifyJS.
Reduce redirects
Each time a page redirects to another page, your visitor faces additional time waiting for the HTTP request-response cycle to complete. For example, if your mobile redirect pattern looks like this: “example.com -> www.example.com -> m.example.com -> m.example.com/home,” each of those two additional redirects makes your page load slower.
Remove render-blocking JavaScript
Browsers have to build a DOM tree by parsing HTML before they can render a page. If your browser encounters a script during this process, it has to stop and execute it before it can continue.
Google suggests avoiding and minimizing the use of blocking JavaScript.
Leverage browser caching
Browsers cache a lot of information (stylesheets, images, JavaScript files, and more) so that when a visitor comes back to your site, the browser doesn’t have to reload the entire page. Use a tool like YSlow to see if you already have an expiration date set for your cache. Then set your “expires” header for how long you want that information to be cached. In many cases, unless your site design changes frequently, a year is a reasonable time period. Google has more information about leveraging caching here.
Improve server response time
Your server response time is affected by the amount of traffic you receive, the resources each page uses, the software your server uses, and the hosting solution you use. To improve your server response time, look for performance bottlenecks like slow database queries, slow routing, or a lack of adequate memory and fix them. The optimal server response time is under 200ms. Learn more about optimizing your time to first byte.
Use a content distribution network
Content distribution networks (CDNs), also called content delivery networks, are networks of servers that are used to distribute the load of delivering content. Essentially, copies of your site are stored at multiple, geographically diverse data centers so that users have faster and more reliable access to your site.
Optimize images
Be sure that your images are no larger than they need to be, that they are in the right file format and that they are compressed for the web.
Use CSS sprites to create a template for images that you use frequently on your site like buttons and icons. CSS sprites combine your images into one large image that loads all at once (which means fewer HTTP requests) and then display only the sections that you want to show. This means that you are saving load time by not making users wait for multiple images to load.
Final part of the report presents our favourites, i.e. optimisation already present
Finally, the site will include two reports, one for mobile and one for desktop computers, each with its own scores and a list of potential problems and issues.
Just browse the two tabs at the top of the report.


